By Mees de Beukelaar
Ultimate Guide to Video Analytics for Social Media
How to measure and optimize social video performance across TikTok, YouTube, Reels and more—metrics, dashboards, tools, and best practices.
Originally published March 6, 2026
In this article
Video analytics is the backbone of understanding how your content performs on platforms like YouTube, TikTok, Instagram, and more. It helps you track critical metrics like views, watch time, engagement, and retention, allowing you to refine your strategy and create content that resonates with your audience. Here's why it matters:
- Understand Audience Behavior: Learn where viewers engage or lose interest.
- Platform-Specific Metrics: Different platforms prioritize different data points (e.g., YouTube values watch time; TikTok focuses on completion rates).
- Boost ROI: In 2025, 93% of marketers reported strong returns from video marketing, with 81% of consumers making purchases after watching a video.
- Improve Content: Use metrics like click-through rates (CTR) and audience retention to identify and fix weak spots.
Top tools like OpenClip and third-party dashboards streamline the process by analyzing trends, automating insights, and optimizing content for each platform. Whether you're tracking organic or paid campaigns, video analytics can save time, cut costs, and drive better results.
How to Read Social Media Analytics Like a Pro (Using Metricool)
Key Video Analytics Metrics to Track
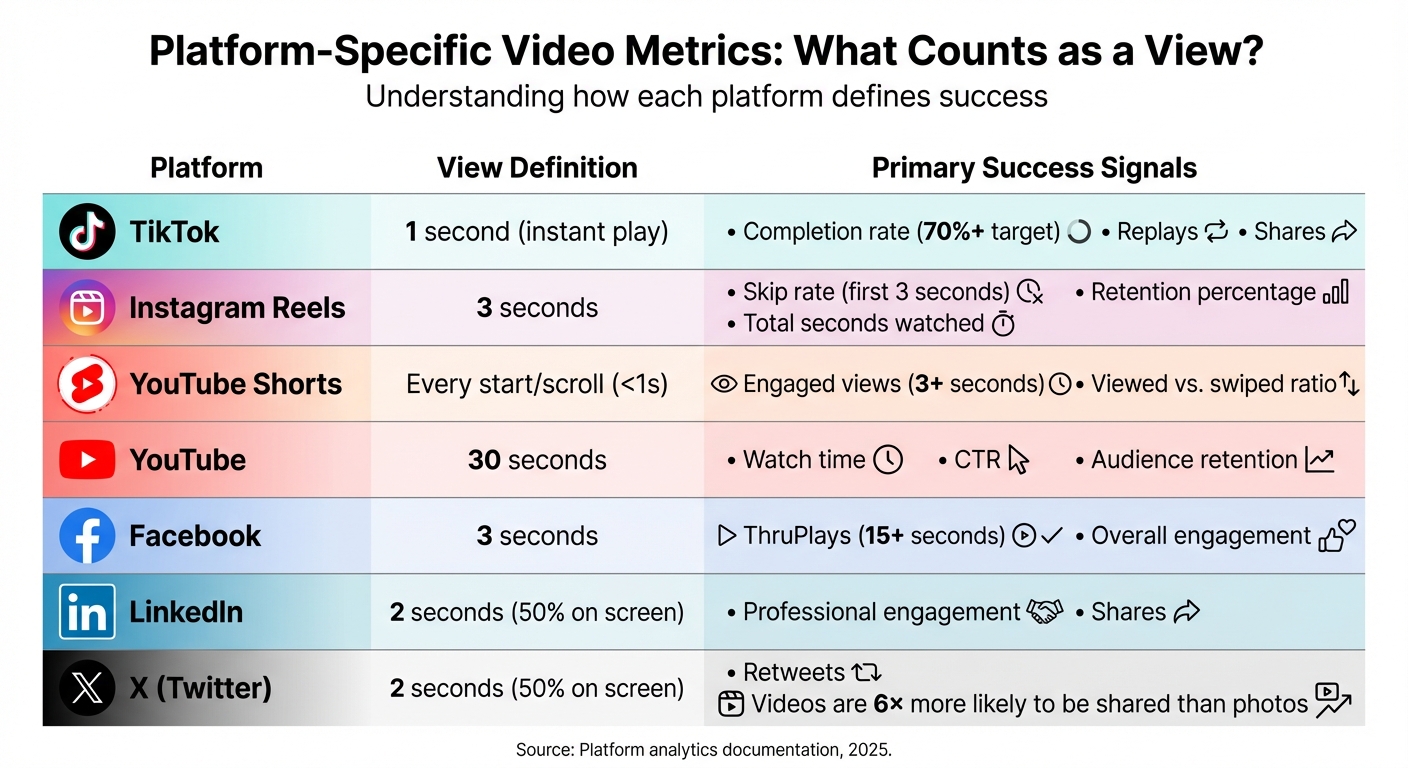
Social Media Platform Video Metrics Comparison Guide
Core Metrics and What They Mean
View count measures how many people have watched your video, but it can be tricky since platforms define "views" differently. For example, TikTok counts a view almost instantly, while YouTube requires 30 seconds. (Details on this are in the platform-specific table below.)
Watch time and average view duration are key indicators of how engaging your content is. Watch time sums up the total minutes viewers spend on your video, while average view duration shows the average time per session. These metrics are crucial for ranking. As Derral Eves, Founder of VidSummit, explains:
"Watch time is the currency of YouTube. The longer you keep people watching, the more YouTube will push your content".
Audience retention and completion rate help identify where viewers lose interest. Retention curves show drop-off points, while completion rate indicates the percentage of viewers who finish your video. For instance, short-form videos typically see completion rates of 60–90%, whereas longer videos average 35–50%.
Engagement rate reflects how well your content connects with your audience. It tracks likes, comments, shares, and saves relative to views. Adam Mosseri, Head of Instagram, emphasizes:
"Engagement rates are more important than follower counts... If your engagement rates are going up, that's a good sign".
On TikTok, a share rate of 1% or higher signals strong viral potential.
Click-through rate (CTR) measures how effective your thumbnail and title are at getting viewers to click. For YouTube, CTRs generally range from 2% to 10%. If your watch time is high but your CTR is low, your content is engaging, but your title or thumbnail might need tweaking. For example, optimizing these elements helped Kit boost its CTR to 15–20%.
Conversion rate ties your video to business results by tracking how many viewers take a specific action, like making a purchase. A great example: Dollar Shave Club’s 2012 YouTube video racked up 25 million views and sold out 250,000 razors in just 72 hours.
Next, it’s important to understand how individual platforms define these metrics, as these nuances can shape your overall analysis.
Platform-Specific Metrics
Each platform has its own way of defining a "view" and prioritizing success signals. Here’s a quick comparison:
Platform View Definition Primary Success Signals TikTok 1 second (instant play) Completion rate (70%+ target), replays, shares Instagram Reels 3 seconds Skip rate (first 3 seconds), retention percentage, total seconds watched YouTube Shorts Every start/scroll (<1s) Engaged views (3+ seconds), viewed vs. swiped ratio YouTube 30 seconds Watch time, CTR, audience retention Facebook 3 seconds ThruPlays (15+ seconds), overall engagement LinkedIn 2 seconds (50% on screen) Professional engagement, shares X (Twitter) 2 seconds (50% on screen) Retweets (videos are 6× more likely than photos)On TikTok, raw view counts don’t reveal much since every play is counted immediately. Instead, focus on completion rates - aim for 80%+ on videos under 30 seconds and 55%+ for videos over a minute. Replays that push watch time beyond 100% signal content worth revisiting.
For Instagram Reels, both the percentage of video watched and total seconds viewed matter. As Adam Mosseri explains:
"If you watched 10 seconds of a minute-long video, that is just as many seconds as if it was 10 seconds of a 10-second video, so you won't be penalized".
This change, introduced in late 2024, ensures longer Reels with quality content remain competitive.
YouTube Shorts added the "Engaged Views" metric in March 2025 to filter out accidental scrolls. Since every scroll-by counts as a view, focusing on views with 3+ seconds watch time offers a clearer picture of genuine interest. Top creators aim for a "viewed" rate of 70–80%, meaning only 20–30% of viewers swipe away immediately.
Understanding these platform-specific metrics helps refine your strategy and uncover meaningful trends.
Using Metrics to Identify Trends
Once you know the metrics, you can use them to spot trends and improve your content. For instance, if the average watch time is much shorter than the video length (e.g., 3 seconds on a 60-second video), your opening might not be grabbing attention. As Mariam (MJ) Ordubadi, Head of Marketing at Aequilibrium, points out:
"The first few seconds are make-or-break. Your video isn't just competing with other content - it's fighting against the scroll reflex".
Retention curves can also highlight problem areas. Sharp drop-offs may mean sections are too long or off-topic, while flat areas indicate moments of high engagement you could emphasize in future videos. If your reach is high but engagement is low, your call-to-action or messaging might need improvement. Conversely, strong engagement but low reach suggests your content is solid but needs better SEO or distribution.
Another emerging trend is loopability - videos designed to seamlessly connect the end back to the beginning, encouraging multiple views. This technique signals algorithms that the content is worth recommending. Formats like the "talking document", where creators explain data or reports in real-time with an on-screen face overlay, are performing especially well for B2B audiences.
If you notice low CTR but high watch time, your content is engaging, but your thumbnail or title might not be compelling enough. Experiment with different options until your CTR improves. Tracking video links with UTM parameters in Google Analytics can also help identify which videos drive traffic and conversions. With 91% of consumers preferring video content over other formats, understanding these trends can directly impact your return on investment.
Top Tools for Video Analytics Integration
After discussing key metrics and native platform tools, let's dive into the top solutions for integrating and optimizing video analytics on social media. Creators often rely on either native analytics or third-party dashboards, depending on their workflow and the platforms they manage.
Native Analytics Platforms
Platforms like TikTok Studio, Instagram Insights, and YouTube Analytics offer built-in tools that provide performance data directly from the source. For instance, TikTok Studio organizes metrics into categories such as follower growth, video views, average watch time, traffic sources, and live engagement. YouTube Analytics focuses on watch time, click-through rates, and audience retention, while Instagram Insights highlights content engagement and audience behavior.
The strength of native tools lies in their precision and platform-specific data. They deliver real-time insights that third-party tools may not capture. Desktop versions of these tools often include advanced visualization features and CSV export options. As Peter Drucker famously said:
"If you can't measure it, you can't manage it".
While native tools provide reliable data, additional solutions can streamline workflows and improve efficiency.
OpenClip: AI-Powered Video Optimization
For creators looking to enhance their workflow, OpenClip offers a powerful AI-driven solution. This platform bridges content creation and analytics by transforming long-form videos into short, shareable clips optimized for platforms like TikTok, Reels, Shorts, X, and LinkedIn. OpenClip uses AI to identify engaging moments and assigns each clip a score to predict its viral potential, helping creators prioritize what to publish.
Here’s how it works: upload a long video - like a podcast or webinar - and OpenClip’s AI evaluates it against current social and marketing trends. The tool then generates multiple clips, complete with automated transcription (97%+ accuracy), dynamic captions, and smart reframing to adapt horizontal videos into vertical formats. Features like ClipAnything and ReframeAnything leverage AI to adapt clips for various genres while keeping key subjects in focus.
OpenClip dramatically reduces editing time, cutting it down from 30–60 minutes to under three minutes. As Lewis Howes puts it:
"It used to take days to create clips. Now it takes us minutes to create them".
Jacksfilms adds:
"OpenClip has been crucial in helping me upload more short-form videos. I get to throw more things at the wall to see what sticks, rather than waste time editing a short that underperforms".
The results speak for themselves. JunkGuy reported a 64% increase in total subscriptions after adopting OpenClip, while another user saw a 266% boost in YouTube "shown-in-feed" metrics and a 57% jump in watch time. Repurposing content with OpenClip can increase organic traffic by 111.3% and cut content creation costs by up to 70%.
OpenClip offers three pricing tiers:
- Free Plan: 30 minutes of processing per month with watermarked exports.
- Pro Plan: $9/month for 180 minutes, no watermarks, and priority processing.
- Business Plan: $29/month for 360 minutes, unlimited brand profiles, and team collaboration.
All plans include automated scheduling, so you can queue clips across platforms without manual uploads.
Benefits of Third-Party Analytics Tools
Third-party analytics tools add another layer of value by consolidating performance data from multiple platforms like TikTok, Instagram, YouTube, and X into a single dashboard. This integration can save creators 5–10 hours per week on data collection. More importantly, these tools allow for standardized metrics, making it easier to compare performance across platforms.
The benefits go beyond time savings. Third-party tools reveal cross-platform trends, helping creators fine-tune their strategies. For example, they can show which formats perform better on specific channels. Businesses using advanced analytics report a 15–20% higher marketing ROI compared to those relying on basic metrics.
Another advantage is competitive benchmarking. Many third-party platforms let you track competitors’ public metrics alongside your own, uncovering gaps and opportunities. Mohamed El-Daly from Create Media shares:
"Socialinsider has saved us more than $16k per year. It has enabled us to save time on monthly reports and complex long-term analyses".
Victor Mukubvu from Mitsubishi Electric adds:
"The competitor analysis helped in creating visibility on how we are performing in the market".
Third-party tools also provide deeper historical data. While native platforms may limit how far back you can look, these tools store long-term trends, making it easier to spot seasonal patterns or measure the impact of strategy changes. However, the trade-off is cost - subscriptions range from $18 to $249 per month depending on features - and minor delays due to API limitations compared to real-time native data.
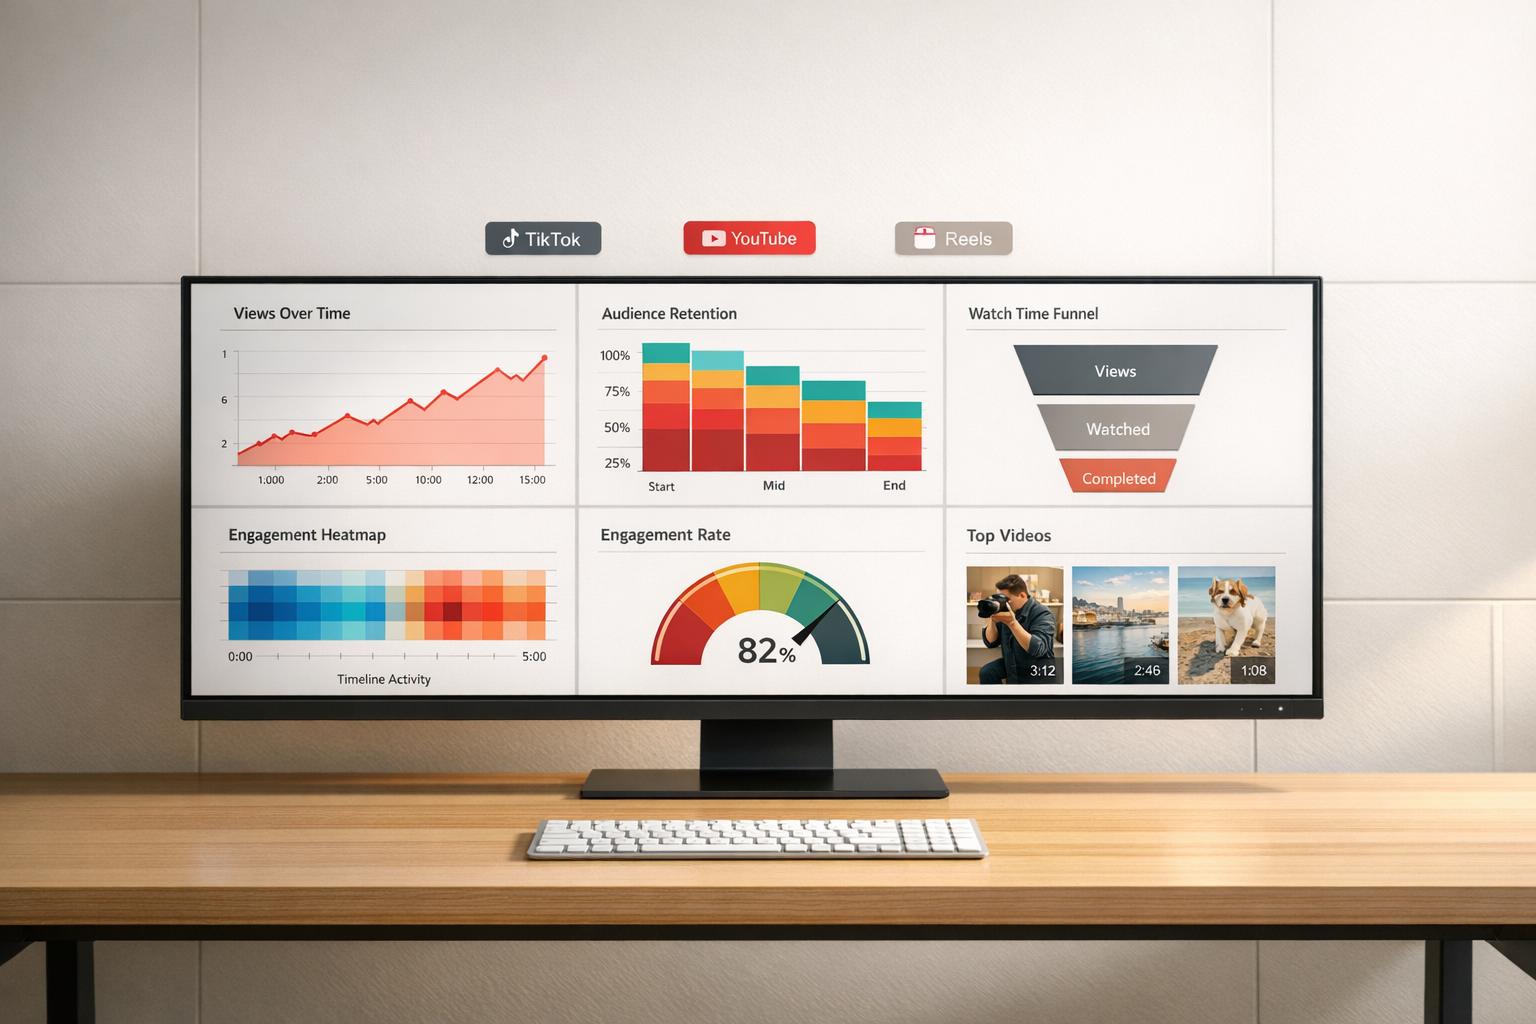
Building and Using a Video Analytics Dashboard
How to Create a Video Analytics Dashboard
Start by identifying your goals. Break down metrics into three main categories: Awareness (like reach and impressions), Engagement (such as watch time and shares), and Conversion (including CTR, leads, and revenue).
Next, pick the right tool. If you're working with a single platform, native tools like YouTube Studio or Meta Business Suite work well. For cross-platform insights, consider third-party options like Metricool ($18/month) or Hootsuite ($99/month). For more advanced needs, enterprise tools like Looker Studio or Power BI can handle complex integrations.
Connect your data sources using OAuth for simplicity. If you need something more advanced, tools like Supermetrics or Coupler.io can feed data into centralized warehouses like BigQuery. Keep in mind that platforms define metrics differently - a "view" on TikTok isn’t the same as on YouTube - so standardizing these definitions is key for accurate comparisons.
Organize your videos by tagging them with themes, formats, or campaigns for easier filtering later. For hosted videos, take things a step further by setting up GA4 events (like video_start, video_progress at 25%, 50%, 75%, and video_complete) and adding UTM parameters to track conversions.
To gauge performance, establish baselines using 30–90 days of data. This helps you identify top-performing videos. Automation can streamline this process, cutting manual data collection time from hours to just 20 minutes.
Once your dashboard is up and running, you can refine it further by focusing on metrics specific to different types of content.
Customizing Dashboards for Paid vs. Organic Content
After building your dashboard, it’s time to tailor it for different types of content.
Paid and organic content have distinct goals and metrics. For organic videos, focus on metrics like reach, follower growth, shares, and watch time. Paid campaigns, on the other hand, prioritize CPV, VTR, ROAS, and CPL.
Use UTM parameters and filters for source/medium to clearly separate paid from organic traffic.
Customize dashboard views based on team roles. For example:
- Demand generation teams track metrics like MQLs and pipeline costs.
- Social media managers focus on engagement metrics, such as shares and comments.
- Executives look at ROI and acquisition costs.
On Instagram, pay attention to "Saves" for organic content, particularly for educational videos. A high number of saves indicates strong value and intent to revisit. For paid campaigns, monitor drop-off rates at the 3-second and 10-second marks. If retention is strong but views are low, the issue might lie in distribution strategies or thumbnails rather than the content itself.
Automating Insights and Alerts
With your dashboard ready and customized, automation can take your analysis to the next level.
Real-time synchronization allows you to respond quickly to algorithm changes or viral trends without waiting for manual updates. Set up automated alerts to track "engagement velocity", helping you identify viral clips within the first 2–4 hours of posting. This early detection can guide you to boost distribution or adapt successful formats quickly.
AI tools can analyze sentiment and assign viral potential scores to your videos, helping you focus on content with the highest ROI.
Automated reporting is another time-saver. Schedule daily or weekly email summaries for stakeholders to ensure consistent, data-driven decisions without constant manual input. Establish a structured review routine: a quick 5-minute daily check, a 30-minute weekly trend analysis, and a more in-depth 90-minute monthly strategy session.
For hosted videos, ensure stable event schemas in GA4 (like video_start, video_progress, and video_complete) for accurate cross-platform comparisons of completion rates.
Automation not only reduces errors but also standardizes metrics across platforms, cutting reporting time from hours to just 20 minutes. By 2025, 73% of creators were using analytics dashboards to drive their growth strategies - up from 52% in 2023 - and 64% reported better decision-making compared to relying solely on native analytics tools.
Best Practices and Use Cases for Video Analytics
Incorporating effective strategies for video analytics can elevate your content quality while streamlining production. Here's how to make the most of it.
Optimizing Content Based on Analytics
Retention graphs are your compass for content improvement. If viewers drop off in the first few seconds, your hook likely needs work. A mid-video drop-off? That’s often a sign your pacing or content relevance needs tweaking. Let the data guide your edits.
Platform-specific strategies are key. For instance, native LinkedIn uploads generate 5× higher view rates than external links. On TikTok, sticking to 15–45 seconds works best, while Instagram content with high "Save" rates often signals evergreen value, even if likes or comments are lower. On TikTok, videos under 15 seconds should aim for an 80%+ completion rate to boost algorithmic visibility.
"Watch time is the currency of YouTube. The longer you keep people watching, the more YouTube will push your content."
- Derral Eves, Founder, VidSummit
For B2B content, deliver your core message in the first 15 seconds to minimize early drop-offs. On short-form platforms like TikTok, "looping" your videos - where the ending ties seamlessly to the beginning - can even lead to completion rates exceeding 100%. Videos with 70% average watch time get 4.3 times more impressions than those with 40% retention.
These insights don’t just fine-tune your content; they also help allocate resources more efficiently for scaling production.
Scaling Content Production with Data Insights
Analytics can reveal which formats and topics resonate most. For example, if tutorials or practical examples show steady retention, double down on those formats. This data-driven approach eliminates guesswork and focuses your efforts where they matter.
AI tools like OpenClip can save time by identifying high-retention segments in long-form videos and converting them into platform-specific clips. Repurposing content in this way can boost organic traffic by 111.3% while reducing production costs by up to 70%. Even small tweaks, like adding captions, can increase view-through rates by 40% and watch time by 12% - important since 80–85% of social media users watch videos without sound.
Batch production informed by analytics is another efficiency booster. Dedicate time to create a week or month’s worth of content in one go, then refine future scripts based on retention data. Weekly analytics audits can also help track follower conversion rates (new followers divided by video views), giving you a clear picture of what builds community versus what simply racks up views.
Case Studies: Success Stories with Video Analytics
Real-world examples show just how impactful video analytics can be.
In July 2025, Dollar Shave Club used audience insights to learn that humor resonated most with their target demographic of young men. Their YouTube ad campaign racked up 25 million views and sold 250,000 razors in just 72 hours, even crashing their website due to the surge in traffic.
The numbers back this up. In 2025, 93% of marketers reported strong ROI from video marketing, and 81% of viewers made a purchase or downloaded an app after watching a video. Plus, people retain 95% of a message when delivered via video, compared to just 10% when reading text. By 2026, 94% of B2B companies were sharing video content across four or more platforms simultaneously.
Adaptation in real-time beats waiting for monthly reports. Marketing teams are now leveraging real-time analytics to make quick adjustments. Automated alerts can flag engagement spikes within the first 2–4 hours of posting. This allows you to amplify distribution or replicate successful formats quickly, turning analytics into a proactive tool rather than a reactive one.
Conclusion and Key Takeaways
Summary of Key Insights
Video analytics have turned content creation into a precise, data-driven process. Instead of relying on vanity metrics, focus on the numbers that truly matter for algorithmic success - watch time, completion rate, and share rate. Each platform has its own priorities: YouTube emphasizes watch time, TikTok values completion rates, and Instagram leans on "Views" as its primary metric.
If more than 40% of viewers drop off within the first three seconds, it’s a clear sign that your hook needs work. Retention graphs are especially useful for identifying where viewers lose interest, giving you actionable insights to tweak your content. To stay ahead, schedule regular analytics reviews - weekly to catch short-term trends and monthly for a deeper dive. A unified analytics dashboard can simplify tracking and help optimize performance across platforms.
AI tools like OpenClip can take this a step further by identifying the most engaging moments in longer videos and turning them into bite-sized clips with captions, scheduling features, and even a virality score.
These strategies provide a clear path to refining your video approach, ensuring every piece of content is backed by actionable data.
Final Thoughts on Video Analytics
The power of video analytics isn’t just theoretical - it’s proven. In 2025, 93% of marketers reported strong ROI from video marketing, and 81% of viewers took action after watching a video. Guesswork is no longer an option.
Start by tracking the right metrics, centralizing your data with an analytics dashboard, and using AI tools to streamline production without sacrificing quality. Success in social media isn’t about producing more content - it’s about creating smarter content that’s informed by real-time data and audience behavior. With a systematic, data-driven strategy, your next viral hit could be just around the corner.
FAQs
Which video metrics matter most for each platform?
When it comes to video metrics, what you should focus on depends on the platform you're using. For TikTok, completion rate, average watch time, and share rate are critical. These metrics not only show how engaging your content is but also influence how the algorithm promotes your videos.
On platforms like Facebook, Instagram, and LinkedIn, the spotlight is on view count and watch time. These numbers help you understand how many people are watching and how long they stay engaged. YouTube, on the other hand, puts a premium on view duration and retention, giving you a clear picture of how well your content holds attention.
No matter the platform, keeping an eye on engagement metrics - like likes, comments, shares, and click-through rates (CTR) - is crucial. These interactions reveal how your audience connects with your content and can guide your future strategy.
How do I standardize “views” and retention across platforms?
To make sense of "views" and retention metrics across platforms, it's crucial to know how each one defines a view. For instance, YouTube counts a view after 30 seconds, while Facebook and Instagram consider it a view after just 3 seconds. To simplify comparisons, you can adopt a consistent benchmark - like a 3-second threshold - across all platforms.
Beyond views, prioritize metrics that offer deeper insights, such as retention, watch time, and engagement rates. These metrics help you better understand viewer behavior, no matter how each platform measures views.
What should I automate in a video analytics dashboard?
Automating tasks for data collection and reporting can save time and help make smarter decisions. By focusing on gathering performance metrics - like views, engagement rates, watch time, and audience demographics - across various platforms, you can get a clearer picture of what's working.
Set up automation for pulling platform-specific data, such as TikTok engagement stats, or tracking KPIs like watch time and completion rates. Adding alerts for metric shifts and using AI-driven insights can take things a step further, helping you fine-tune campaigns and improve strategies with less manual effort.
Turn one video into a week of content.
Try OpenClip free